

Technology
A hybrid digital twin that predicts which action is most economical, and when
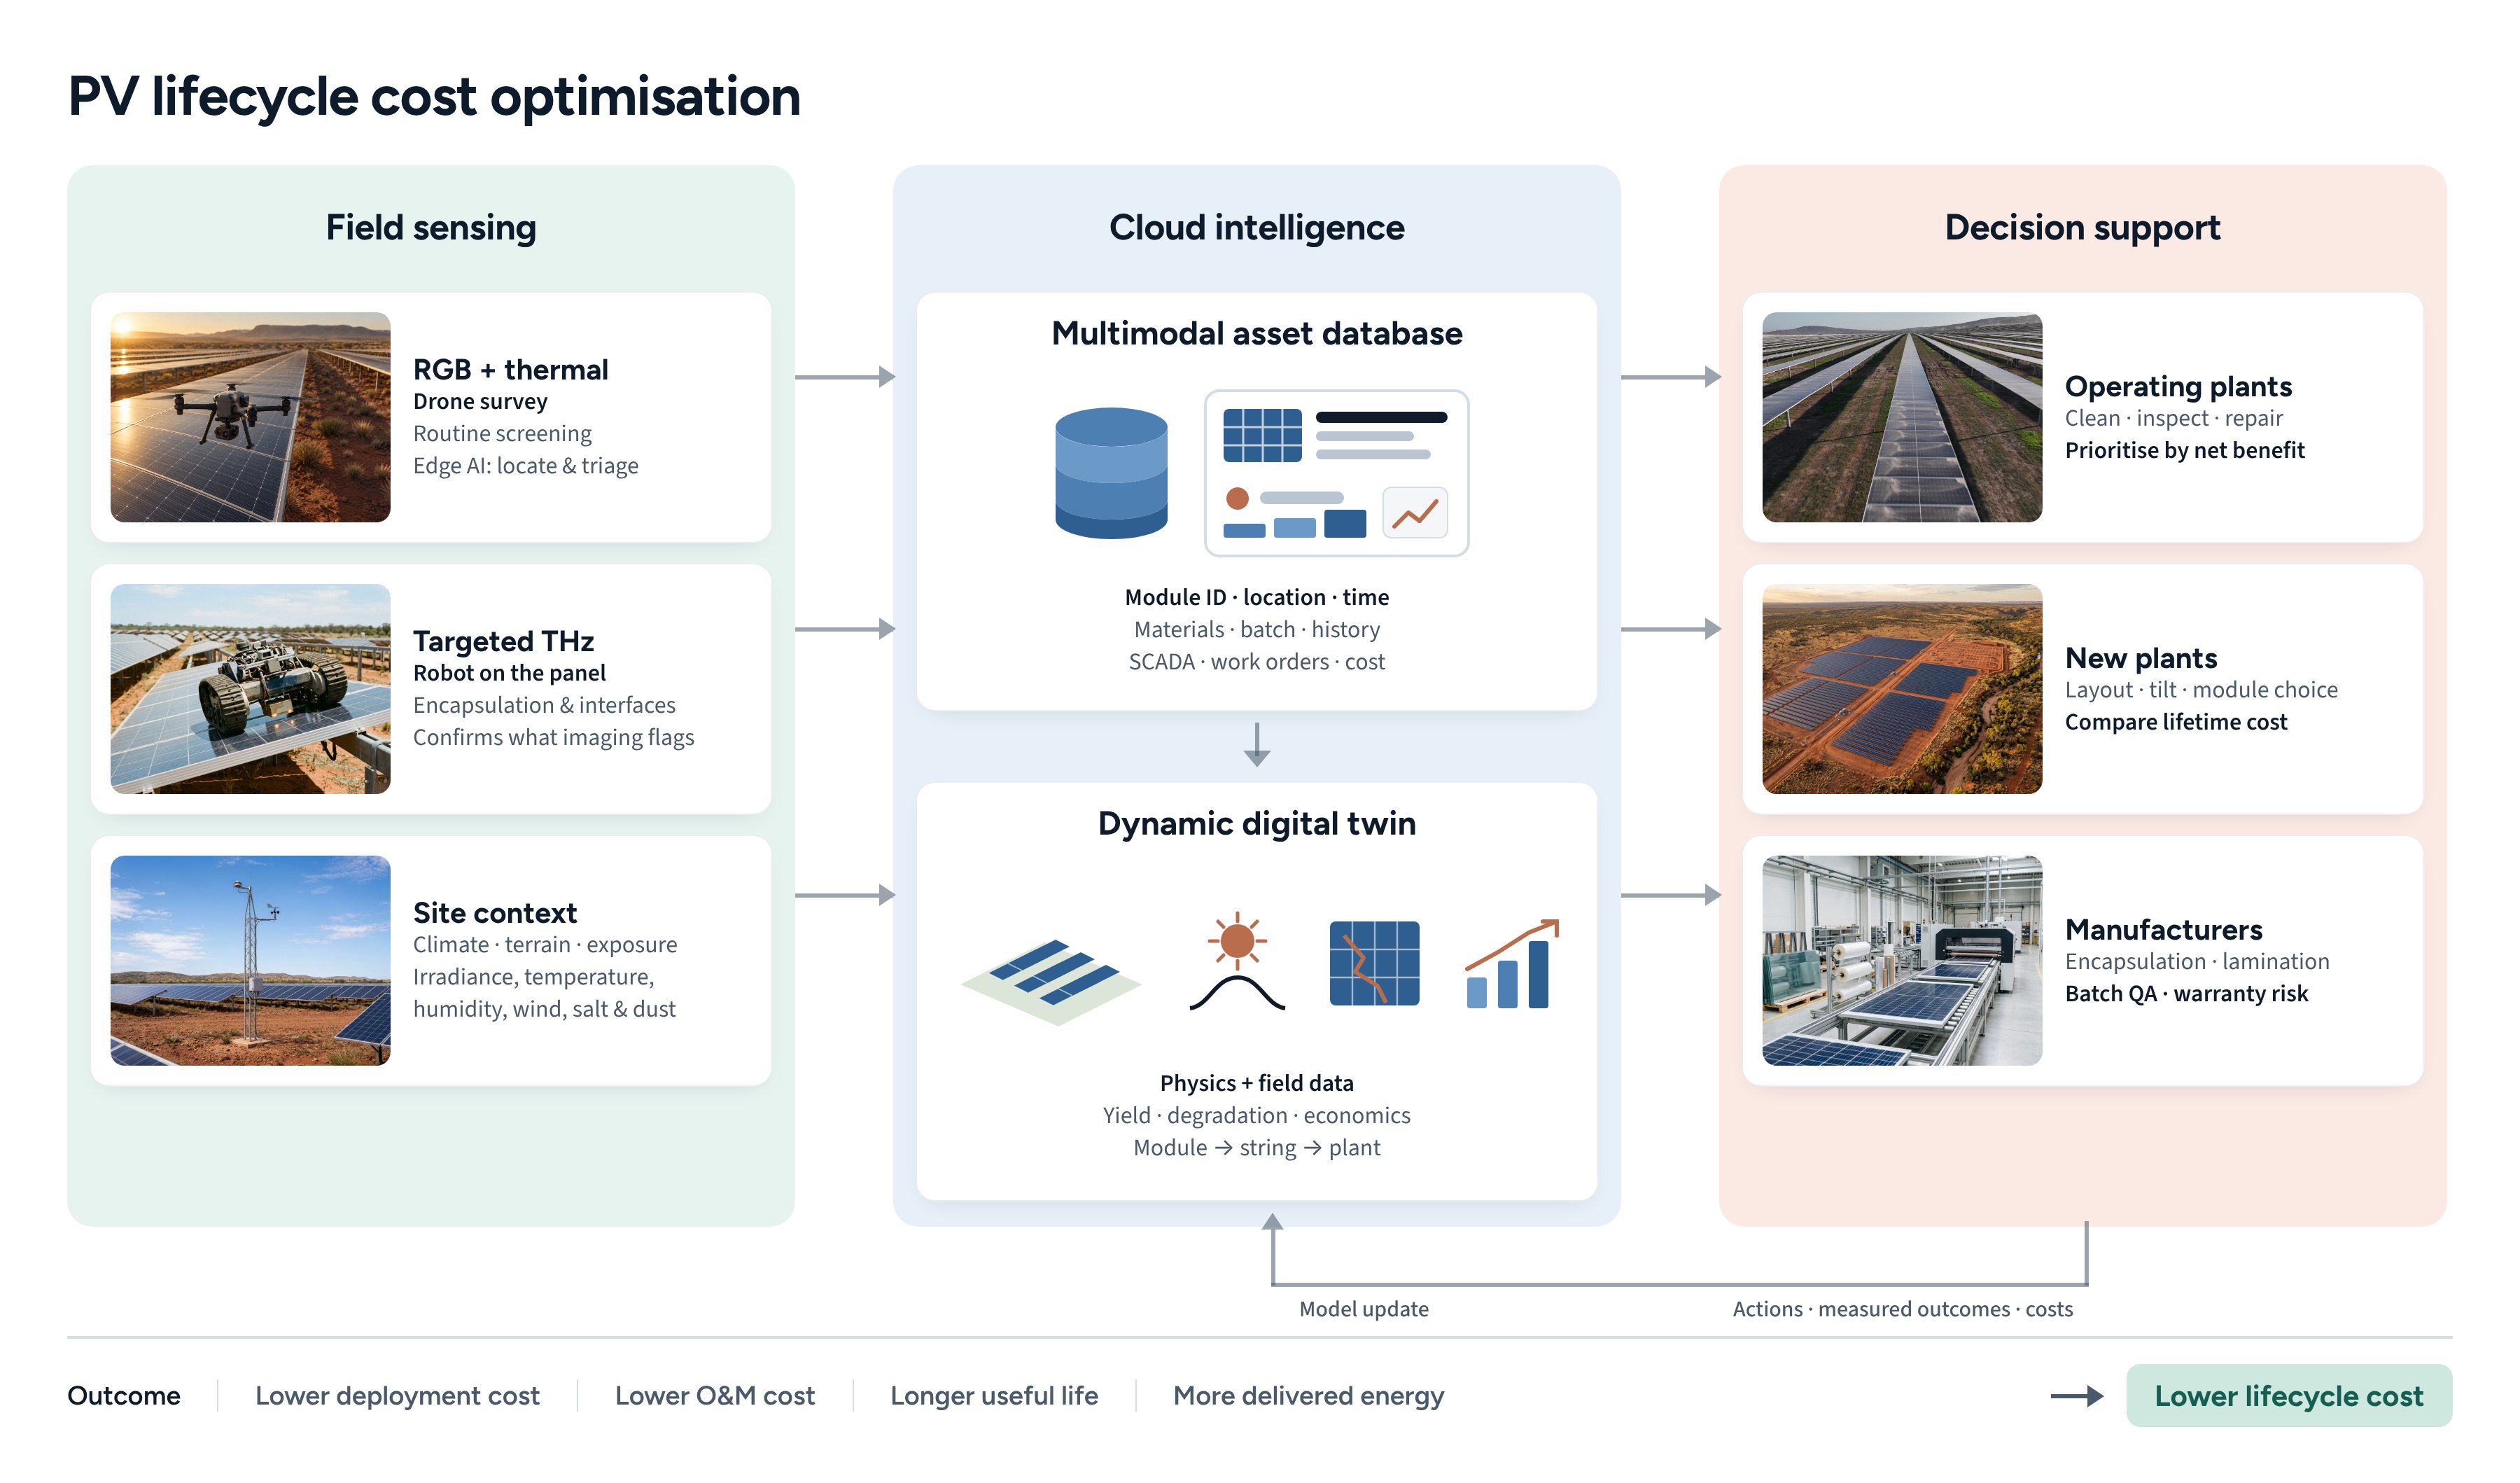
Physics and data combined to optimise the economic value of interventions while continuously updating asset condition. Models track specific assets, compare intervention outcomes and make predictions that later observations can falsify.
The evidence chain
Every link is recorded, so field observations become lifecycle decisions
- Materials and processes
- Environmental exposure
- Condition evolution
- Energy losses
- Intervention outcomes
Sensing
The drone finds candidates. The robot confirms them.
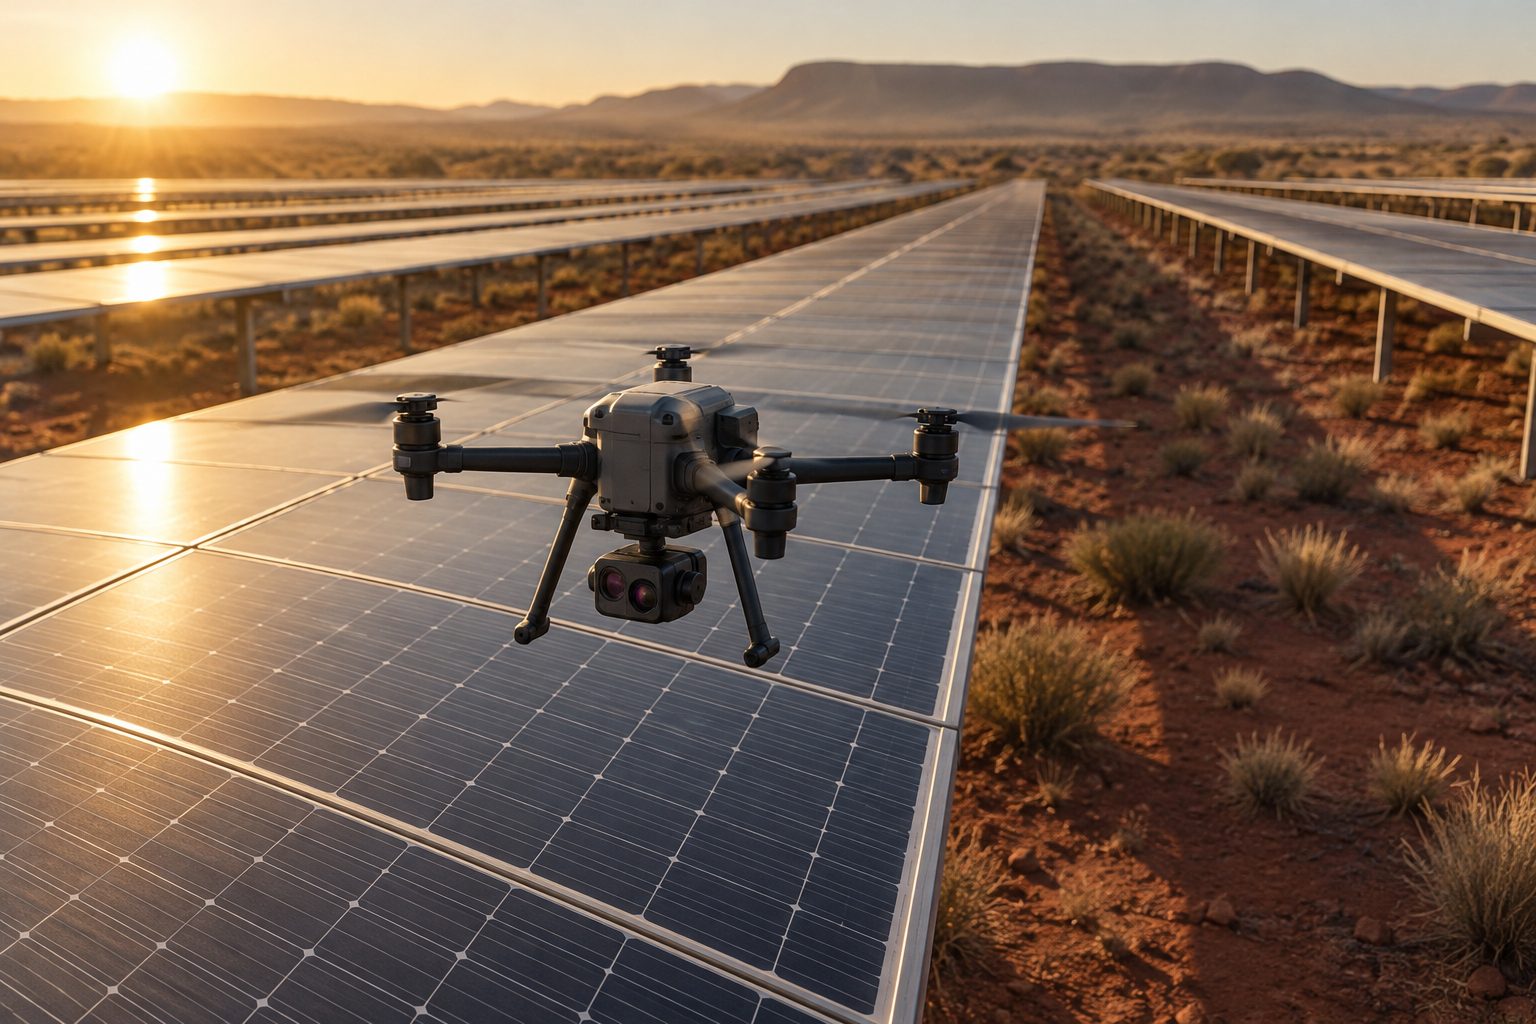
Drone RGB and thermal screening
Drones run scheduled and event-triggered surveys. Edge computing performs image quality checks, module localisation and anomaly grading before data leaves the site, with offline caching for remote plants.
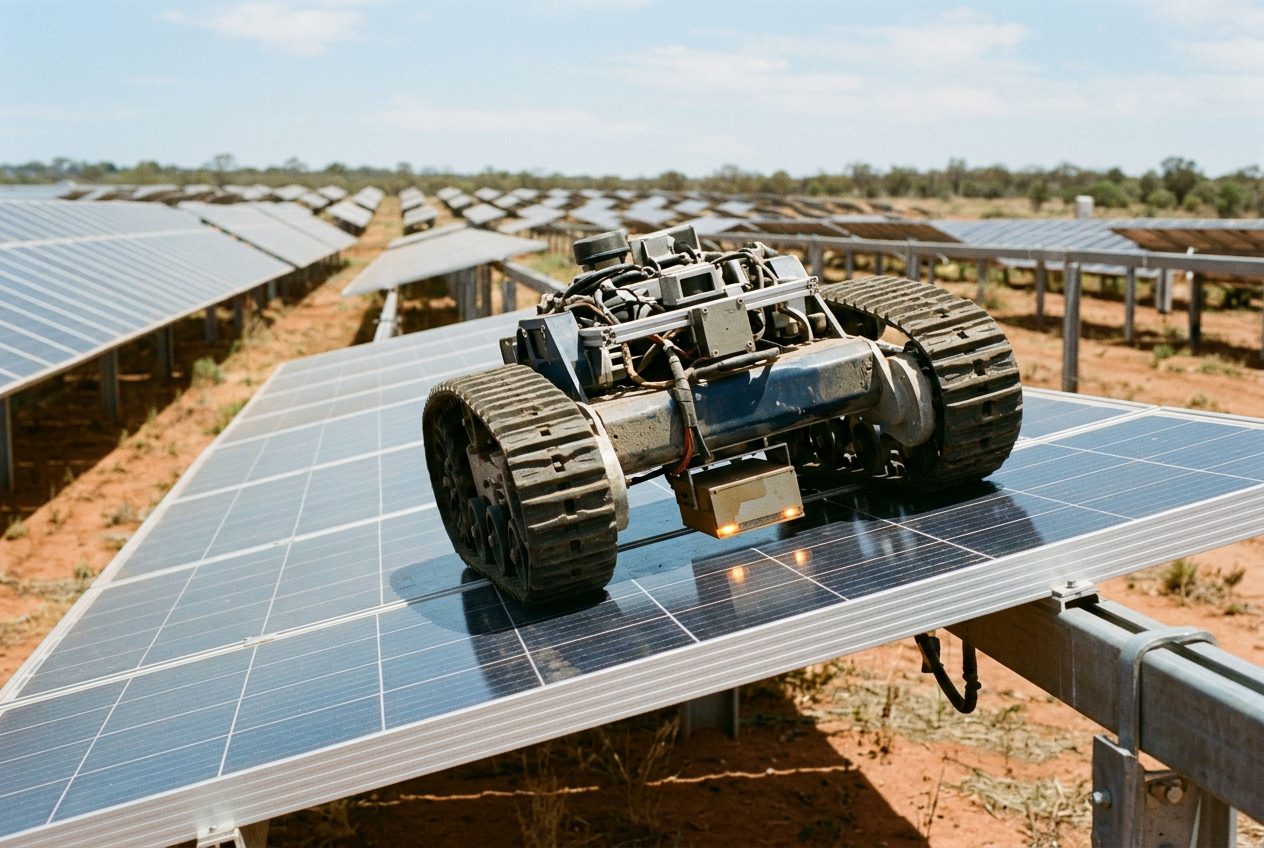
Robot terahertz, on the panel
A robot moves onto flagged modules and scans at close range. Scans of high-risk locations and stratified healthy samples give identifiable evidence of interface and dielectric state within compatible encapsulation structures. Scans are allocated where the extra information changes the intervention choice and expected avoided loss exceeds the cost.
Site and microclimate context
Terrain, shading and long-term regional climate are combined with on-site irradiance, module and ambient temperature, humidity, wind, salt and dust, to separate regional conditions from microenvironments within the array.
Fast and slow states
Operating states follow existing SCADA updates. Slower material states update through inspections, accumulated exposure and extreme events, so each modality updates the same asset's state distribution through calibrated observation models.
The climate and condition database
Where every module is, what it is made of, and how it is behaving
The core asset is a database that links each module to the place it lives. Over time it becomes a map of how solar hardware ages across Australia's climate zones, and a guide to what to build where.
- 1Monsoonal northHeat, humidity, UV, cyclones
- 2Arid interiorExtreme heat, dust, thermal cycling
- 3Subtropical eastHumidity, hail, storms
- 4Temperate south-eastFrost, rain, moderate UV
- 5Mediterranean south-westSalt, dry heat, winter rain
- 6Cool temperate TasmaniaWind, moisture, low irradiance
Each module, as a record
Manufacturer, model, bill of materials, factory batch and lamination record, install date, string position and mounting. Then every drone image, thermal frame, terahertz scan, work order and replacement, with timestamps.
Linked to its environment
Climate zone, long-term weather history, terrain and shading, distance from the coast, salt and dust load, vegetation and fire exposure, plus on-site irradiance, temperature, humidity and wind, down to the microclimate inside the array.
Linked to its performance
SCADA and string-level electrical data, weather-normalised, so condition changes can be tied to energy loss at the metering resolution available.
Six climate zones as the proving ground
From the monsoonal north to temperate Tasmania, each zone has its own dominant degradation mechanisms. Sites are stratified across them so the same materials can be compared under different exposure.
From database to degradation map
Repeat inspections of the same modules, season after season, turn individual findings into degradation rates by material, batch and zone, then into a fleet-wide risk ranking.
From map to deployment guidance
Invert the model: given a site's terrain, climate and a proposed module construction, estimate degradation, maintenance cost and premature replacement risk before a single post goes in.
Data and models
One asset record, a hierarchy of twins
Module IDs, locations, electrical topology, manufacturing batches and replacement histories link RGB, thermal and terahertz inspections with exposure, SCADA data, work orders and actual expenditure.
Aligned before attributed
Timestamps, units, calibration records and data versions are standardised and terminology mapped to PV-Onto. Inconsistent sampling and interval averaging cause systematic power-prediction errors, so alignment precedes any anomaly attribution.
Physics sets the baseline
Irradiance, heat-balance and electrical models establish normal-operation baselines. Hierarchical degradation models represent cumulative environmental effects. Cost models evaluate interventions.
Machine learning where it earns its place
Parameter estimation, residual modelling and fast surrogate predictions. Model selection stays problem-specific: established solvers are used where they outperform learned ones, and historical fit is never treated as proof of long-term accuracy.
Credibility tied to use
Verification of implementation, parameter calibration and independent predictive evaluation are kept distinct, with credibility defined for specific operating conditions, prediction horizons and decisions.
The loop
Predictions are tested against outcomes, then the models update
Before a work order is issued, the system records predicted net benefit, timeframe and prediction interval for cleaning, repair, replacement and deferral. Weather normalisation and controlled comparisons between cleaning zones then assess what actually happened.
Each intervention's cost, condition change and generation response feeds back into the models. New sites, unrepresented materials or significant drift trigger reassessment, so field experience improves subsequent maintenance, plant design and module production.
Australian sites are stratified by temperature and humidity cycling, UV, salt and dust, rainfall and extreme-event exposure, with array microclimates, remote-site travel, communications constraints and local service costs built in. Model structures and priors are shared across sites while calibration stays local.
Want the technical detail?
We are happy to walk engineering and asset-management teams through the sensing, data model and twin architecture.